PyClustering library

Introduction

PyClustering is an open source data mining library written in Python and C++ that provides a wide range of clustering algorithms and methods, including bio-inspired oscillatory networks. PyClustering is mostly focused on cluster analysis to make it more accessible and understandable for users. The library is distributed under GNU Public License and provides a comprehensive interface that makes it easy to use in every project.

By default, the C++ part of the library is used for processing in order to achieve maximum performance. This is especially relevant for algorithms that are based on oscillatory networks, whose dynamics are governed by a system of differential equations. If support for a C++ compiler is not detected, PyClustering falls back to pure Python implementations of all kernels.

PyClustering consists of five general modules.

Cluster analysis algorithms and methods (module pyclustering.cluster):

Oscillatory and neural network models (module pyclustering.nnet):

Graph coloring algorithms (module pyclustering.gcolor):

Containers (module pyclustering.container):

Utils (pyclustering.utils) that can be used for analysis, visualization, etc.

Installation

The simplest way to install pyclustering library is to use pip:

pip3 install pyclustering

The library can be compiled and manually installed on Linux or MacOS machine wherever you want:

# extract content of the pyclustering library...
# compile CCORE library (core of the pyclustering library).
cd pyclustering/ccore
make ccore_x64 # if platform is x86_64 (64-bit)
# make ccore_x86 # if platform is x86 (32-bit)
# return to parent folder of the pyclustering library
cd ../
# add current folder to python path
PYTHONPATH=`pwd`
export PYTHONPATH=${PYTHONPATH}

Cite the Library

If you are using pyclustering library in a scientific paper, please, cite the library:

Novikov, A., 2019. PyClustering: Data Mining Library. Journal of Open Source Software, 4(36), p.1230. Available at: http://dx.doi.org/10.21105/joss.01230.

BibTeX entry:

@article{Novikov2019,
doi = {10.21105/joss.01230},
url = {https://doi.org/10.21105/joss.01230},
year = 2019,
month = {apr},
publisher = {The Open Journal},
volume = {4},
number = {36},
pages = {1230},
author = {Andrei Novikov},
title = {{PyClustering}: Data Mining Library},
journal = {Journal of Open Source Software}
}

Examples

The library provides intuitive and friendly interface. Here is an example how to perform cluster analysis using BIRCH algorithm:

from pyclustering.cluster import cluster_visualizer
from pyclustering.cluster.birch import birch
from pyclustering.samples.definitions import FCPS_SAMPLES
from pyclustering.utils import read_sample
# Load data for cluster analysis - 'Lsun' sample.
sample = read_sample(FCPS_SAMPLES.SAMPLE_LSUN)
# Create BIRCH algorithm to allocate three clusters.
birch_instance = birch(sample, 3)
# Run cluster analysis.
birch_instance.process()
# Get allocated clusters.
clusters = birch_instance.get_clusters()
# Visualize obtained clusters.
visualizer = cluster_visualizer()
visualizer.append_clusters(clusters, sample)
visualizer.show()

Here is an how to perform cluster analysis using well-known K-Means algorithm:

from pyclustering.cluster.kmeans import kmeans, kmeans_visualizer
from pyclustering.cluster.center_initializer import kmeans_plusplus_initializer
from pyclustering.samples.definitions import FCPS_SAMPLES
from pyclustering.utils import read_sample
# Load list of points for cluster analysis.
sample = read_sample(FCPS_SAMPLES.SAMPLE_TWO_DIAMONDS)
# Prepare initial centers using K-Means++ method.
initial_centers = kmeans_plusplus_initializer(sample, 2).initialize()
# Create instance of K-Means algorithm with prepared centers.
kmeans_instance = kmeans(sample, initial_centers)
# Run cluster analysis and obtain results.
kmeans_instance.process()
clusters = kmeans_instance.get_clusters()
final_centers = kmeans_instance.get_centers()
# Visualize obtained results
kmeans_visualizer.show_clusters(sample, clusters, final_centers)

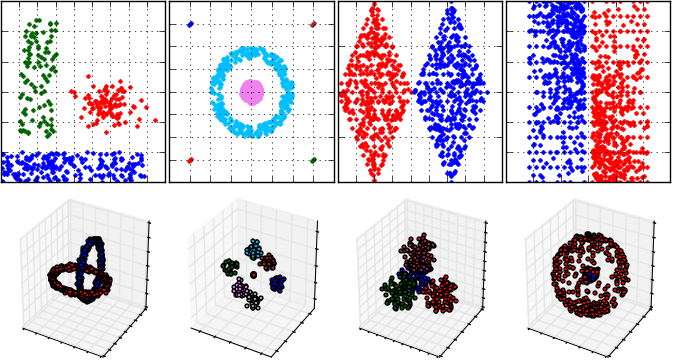
An example cluster analysis (that is performed by DBSCAN algorithm) for FCPS samples and visualization of results:

fcps_cluster_analysis.png

An example of Hodgkin-Huxley oscillatory network simulation with 6 oscillators. The first two oscillators have the same stimulus, as well as the third and fourth oscillators and the last two. Thus three synchronous ensembles are expected after simulation.

from pyclustering.nnet.hhn import hhn_network, hhn_parameters
from pyclustering.nnet.dynamic_visualizer import dynamic_visualizer
# Change period of time when high strength value of synaptic connection exists from CN2 to PN.
params = hhn_parameters()
params.deltah = 400
# Create Hodgkin-Huxley oscillatory network with stimulus.
net = hhn_network(6, [0, 0, 25, 25, 47, 47], params)
# Simulate network.
(t, dyn_peripheral, dyn_central) = net.simulate(2400, 600)
# Visualize network's output (membrane potential of peripheral and central neurons).
amount_canvases = 6 + 2 # 6 peripheral oscillator + 2 central elements
visualizer = dynamic_visualizer(amount_canvases, x_title="Time", y_title="V", y_labels=False)
visualizer.append_dynamics(t, dyn_peripheral, 0, True)
visualizer.append_dynamics(t, dyn_central, amount_canvases - 2, True)
visualizer.show()