 |
 |
Visualizer for cluster in multi-dimensional data. More...
Public Member Functions | |
| def | __init__ (self) |
| Constructs cluster visualizer for multidimensional data. More... | |
| def | append_cluster (self, cluster, data=None, marker='.', markersize=None, color=None) |
| Appends cluster for visualization. More... | |
| def | append_clusters (self, clusters, data=None, marker='.', markersize=None) |
| Appends list of cluster for visualization. More... | |
| def | show (self, pair_filter=None, kwargs) |
| Shows clusters (visualize) in multi-dimensional space. More... | |
Visualizer for cluster in multi-dimensional data.
This cluster visualizer is useful for clusters in data whose dimension is greater than 3. The multidimensional visualizer helps to overcome 'cluster_visualizer' shortcoming - ability to display clusters in 1D, 2D or 3D dimensional data space.
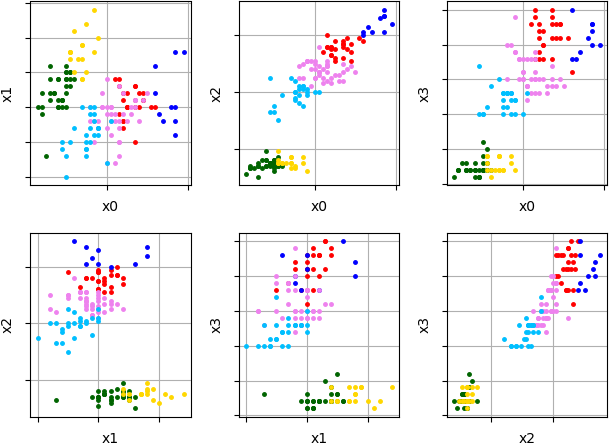
Example of clustering results visualization where 'Iris' is used:
Visualized clustering results of 'Iris' data (multi-dimensional data):

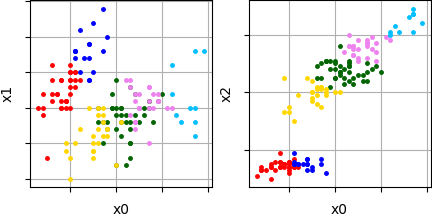
Sometimes no need to display results in all dimensions. Parameter 'filter' can be used to display only interesting coordinate pairs. Here is an example of visualization of pair coordinates (x0, x1) and (x0, x2) for previous clustering results:
Visualized results of specified coordinate pairs:

Definition at line 77 of file __init__.py.
| def pyclustering.cluster.cluster_visualizer_multidim.__init__ | ( | self | ) |
Constructs cluster visualizer for multidimensional data.
The visualizer is suitable more data whose dimension is bigger than 3.
Definition at line 124 of file __init__.py.
| def pyclustering.cluster.cluster_visualizer_multidim.append_cluster | ( | self, | |
| cluster, | |||
data = None, |
|||
marker = '.', |
|||
markersize = None, |
|||
color = None |
|||
| ) |
Appends cluster for visualization.
| [in] | cluster | (list): cluster that may consist of indexes of objects from the data or object itself. |
| [in] | data | (list): If defines that each element of cluster is considered as a index of object from the data. |
| [in] | marker | (string): Marker that is used for displaying objects from cluster on the canvas. |
| [in] | markersize | (uint): Size of marker. |
| [in] | color | (string): Color of marker. |
Definition at line 135 of file __init__.py.
Referenced by pyclustering.cluster.cluster_visualizer_multidim.append_clusters(), and pyclustering.cluster.cluster_visualizer.append_clusters().
| def pyclustering.cluster.cluster_visualizer_multidim.append_clusters | ( | self, | |
| clusters, | |||
data = None, |
|||
marker = '.', |
|||
markersize = None |
|||
| ) |
Appends list of cluster for visualization.
| [in] | clusters | (list): List of clusters where each cluster may consist of indexes of objects from the data or object itself. |
| [in] | data | (list): If defines that each element of cluster is considered as a index of object from the data. |
| [in] | marker | (string): Marker that is used for displaying objects from clusters on the canvas. |
| [in] | markersize | (uint): Size of marker. |
Definition at line 160 of file __init__.py.
| def pyclustering.cluster.cluster_visualizer_multidim.show | ( | self, | |
pair_filter = None, |
|||
| kwargs | |||
| ) |
Shows clusters (visualize) in multi-dimensional space.
| [in] | pair_filter | (list): List of coordinate pairs that should be displayed. This argument is used as a filter. |
| [in] | **kwargs | Arbitrary keyword arguments (available arguments: 'visible_axis' 'visible_labels', 'visible_grid', 'row_size'). |
Keyword Args:
Definition at line 175 of file __init__.py.